ESPN just released NET points, a new NBA metric. Here's how to DIY.
The full recipe, plus the advanced data you'll need

Dean Oliver, the OG of basketball analytics, has released a new metric at ESPN called NET Points.
While it is an impact metric, it is different from the xRAPMs, BPMs and EPMs of the world in the sense that it aims to determine a player's contribution for a single game.
xRAPM, etc., on the other hand, tries to predict a player's impact on the team's plus-minus going forward.
Interestingly, the process of building a metric like NET points is similar to building BPM, but also significantly simpler.
In what follows, I will supply you with the most important ingredient — and the recipe — so you can build your own high-level single-game impact metric!
The main ingredient
At the core of all these metrics lies the following question: How to determine weights for BoxScore (or PlayByPlay-derived) stats in a objective, scientific manner.
BPM, for example, arrives at BoxScore weights by doing a regression with multiyear RAPM as the so-called "dependent variable," and multiyear player statistics as the "independent variables.”
This technique was originally developed by Dan Rosenbaum and is called "Statistical Plus-Minus" (SPM).
The same approach, with slight modifications, can be used to build a metric like NET points.
These days, almost all advanced metrics do some version of the above, as one part of the many steps necessary to compute them.
Even if you aren't a fan of adjusted plus-minus (APM) or plus-minus stats in general, this step is essential in a metric's early stages — even if the metric ultimately aims to be BoxScore-only.
The objectivity of APM is crucial, since otherwise any kind of subjective input will just worsen a metric's accuracy and its predictive power.
Many choices
Of course there are several different flavors of APM. Choosing the best one should come down to what gets you best results, but here's a quick rundown of the most important bits:
Use the more accurate cousin of APM, RAPM instead. It uses penalization to combat the noise that's inherent in lineup data.
Use different penalization terms for offensive and defensive impact — players have more impact on a team's offensive performance.
Use an appropriate time window for the two datasets. If, say, we want to include stats like deflections in our model, the RAPM time window shouldn't start before 2016, the first year deflection data became available.
Use some sort of age adjustment.
Ponder coaching, rubber-band, and other adjustments.
The final result, 2016/17-2024/25 RAPM, looks like this:
I'd say that's a list that's very hard to argue with. We’ve covered why Wagner might be underrated in other places.
Determining weights for the stats
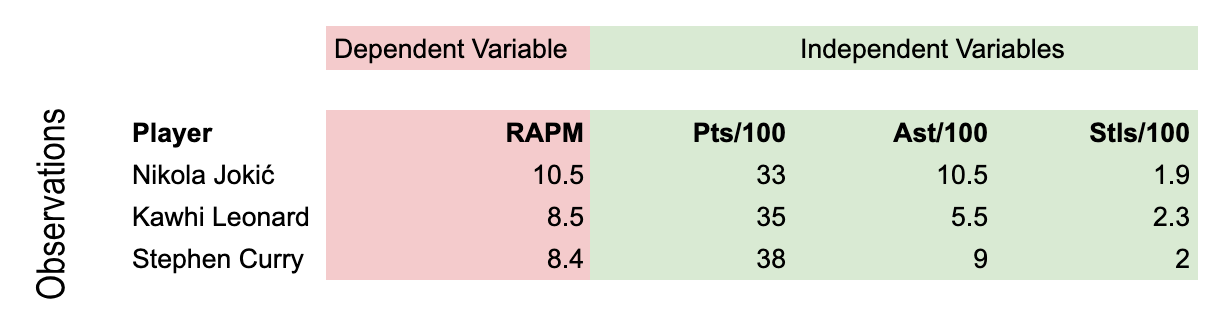
The above, then, can simply be put in a standard regression analysis with RAPM as the dependent variable, and the players' stats as the independent variables we want to generate weights for.
In below-pictured setup, we'd get weights for points, assists, etc.
Complications that vanish
If we were building an actual SPM, I'd have to go on a longer tangent on how to come up with weights for each observation.
Why? The RAPM estimate for LeBron is more accurate than the one for Wagner — it has a lower "standard error" — because LeBron has played more minutes, and with more different teammates.
Thus, its signal-to-noise ratio is higher, and weighing the observation connected to LeBron more heavily would be wise.
My APBR forum post from many years back on how to generate RAPM standard errors has been lost in a hack. But here’s a writeup by Justin Jacobs.
Another consideration is to — rather than using the players' per-100 stats at face value — use the players' estimated career "skill levels.” To give another example: We shouldn't believe that a player who made 5 of his first 10 three-point attempts will continue to make 50%.
The resulting stat estimates, then, would need some sort of scaling. Z-Scoring is the technique most prominently used here, telling us how many standard deviations a player is away from average in these stats.
But those methods all fall to the wayside if we're interested in single-game impact.
Because we want to know the value of single actions, we can simply put in the stat totals.
And the weighting issue will be taken care of by using a slightly modified dependent variable, described below.
The final steps
What Table 1 doesn't tell us is a player's total contribution across the selected time window, because we're not taking into account playing time. But since we're now building a metric that estimates game impact, all we care about are total contributions.
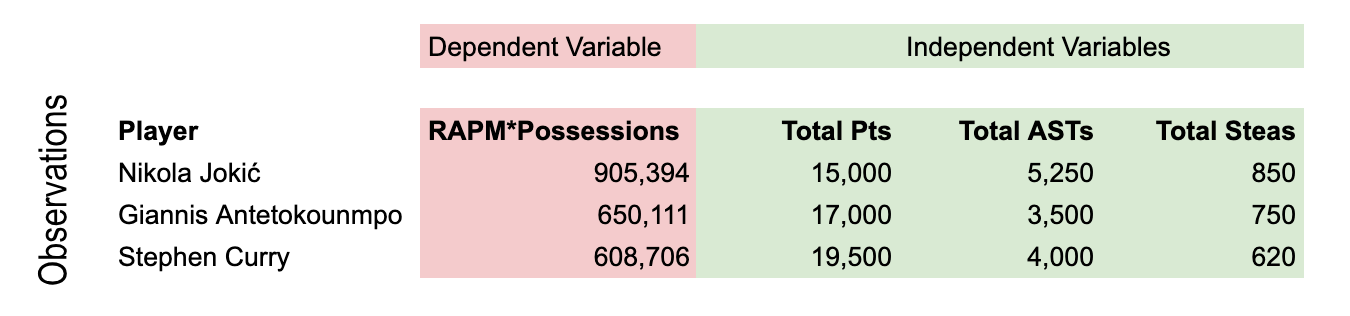
We can rectify that situation and determine a plus-minus-based total contribution by multiplying the players' RAPM values with the total number of possessions played, arriving at the following table:
You can find the full data here
The final regression setup then, consists of RAPM*possessions as the new dependent variable, and the players' total stats as independent variables:
Here's a snippet of the resulting stat coefficients/weights:
And an estimate of total contributions for the 2024-25 season:
And a ranking of the top and bottom contributors per 160 possessions:
How does it compare to “PIE”?